Tuesday, October 27, 2009
Any interest in wheat or other crops?
Week 30
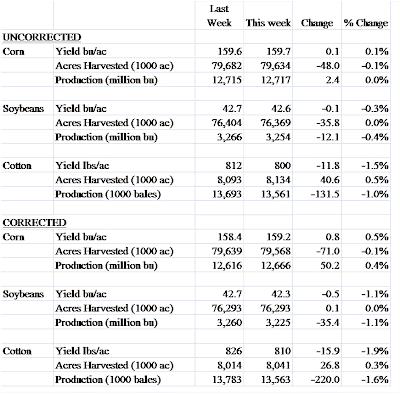
The yield numbers for cotton have fallen substantially since the first part of September. You will see in earlier posts where I think my errors are coming from on the production side (TX and AR). The yields, however, have tracked USDA reasonably well and so if you fit the model changes to USDA points we might see some sizable reductions in the USDA cotton production numbers in August. I should note that New Mexico has not reported conditions yet for the week so I'm using last weeks conditions carried over. Given the small size of New Mexico and the likelyhood of large changes in thier conditions from one week, this is probably not having a noticable effect on the outcome. You will be hardpressed to see the change when they finally release thier numbers.
I'll continue to post as long as I have conditions and then again near the time of the USDA November report, maybe the December report for cotton and then after the January report where numbers are usually 'final' or at least change little from that point for production and yield. Again I'll solicit any comments you have concerning this blog.

Wednesday, October 21, 2009
Spreadsheet link fixed
Tuesday, October 20, 2009
Why no corrected number for soybeans this week?
I probably should have gone ahead and published the correction, but it would require a bit of an explanation. Let me go ahead and do that and see if you readers out there think it should be investigated further. So with potentially fewer observations (not calculated how many) the adjustment this week would be significant. I'd be down to 41.2 bushels an acre. Down about a full bushel from last week. The adjustment in Iowa and Illinois would be about 2 bu/ac. This the last week I'd get any adjustment at all, we have not had bean conditions past week 29 in my calendar
Now it could simply be some fluke of the small number of observations available this late in the year or it could be that conditions tend to significantly over estimate yields when harvest is delayed, or the delay itself results in lower yields. I certainly don't have enough information to draw any conclusion.
It also looks like I trimmed off LAST weeks soybean corrected numbers, so here they are again for completeness. They do NOT include this weeks adjustment with just three observations.


Monday, October 19, 2009
Week 29
Soybeans: I've consistently been a bit higher than USDA all season, but by less than 1/2 a bushel per acre. What is worth noting that the estimated yield slid again this week and has been on a downward trajectory since mid-September.
Cotton: I'm actually pleasantly surprised how the model has tracked along with USDA estimates on cotton yields. The reports of worsening crops and harvest difficulties appear to be showing up in conditions and if the model is truly tracking well, we might see a sizable downward revision in yield numbers come November. Now my crop production number has consistently been above the USDA number. I'd say 1/2 of this is due to abandonment differences in Texas. The model just does not seem to do well in predicting harvested acres in Texas. The other big difference is in Arkansas where current conditions are well outside of the range seen since 1986. So when determining parameters for the lowest category, the model isn't distinguishing yields much. This will change when I re-estimate after the first of the year. So I'm well above USDA.


Thursday, October 15, 2009
So where did it 'all go wrong' ?
Well it is clear that one big source of difference is the Illinois corn yield. I currently have 163.1 bu/ac in my corrected model while the USDA is running 179 bu/ac. Is it conditions? Well conditions don't tell much of the story. In 2004 IL yield was 180, in 2008 it was 179 so while trend yields are important here (I'm running 2.7 bu/ac growth annually) lets set that aside for the moment and look at conditions for this week in history.
2004: VP-1 P-2 F-13 G-57 E-27
2008: VP-1 P-4 F-23 G-52 E-20
2009: VP-1 P-6 F-28 G-52 E-13
So conditions are worse than those previous years. So while conditions could still be it, lets look at what I'm getting from the other variable, planting progress. Because this is just a hobby, I search for the most significant planting progress percent among a number of weeks for each state. I try to make the date later as I go north in the states. Well I used the week May 6-12 percent planted for Illinois this year. Now the high in this week over the last five years is 95%, the low is last year at 60%...This year? 10%. This is giving me one heck of a yield hit. If I simply go in and put the 5 year average for planting progress in for Illinois (78.8% planted) my new Illinois yield is 177.7 bushels an acre. Within 1.5 bushels of the USDA estimate. While that doesn't solve everything, it does put me closer to USDA, here is my total if I make that simple change. Now this week, the numbers from the USDA STILL put me quite far off, but I'm a more reasonable distance from the estimate.
Using the average planting progress of the last 5 years JUST for Illinois

So, clearly the USDA estimate suggests I have far to0 much of an impact on terminal yield based on planting progress. This could be because I have the wrong 'week' as the indicator, but planting was delayed across all the weeks to some extent. Maybe it is because farmers can get into the fields and get it all planted more quickly now than before, or maybe the seed technology is different. Or it could be that in previous years, delayed planting resulted in freeze issues that are not materializing this year, or, was the weather just cooperative this year and we didn't have the 'hot and dry' spell that would have crushed a late planted crop?
The same issue is present for IN and MI, but I'm using a bit later week for OH and planting progress was about 'normal' this week and thus you will note that I'm actually above USDA. While there are still several weeks left, I'm not sure I hold much hope to close that much of a gap. What I can say is that planting progress is playing a bigger role this year than I anticipated it would.
Monday, October 12, 2009
Thursday, October 8, 2009
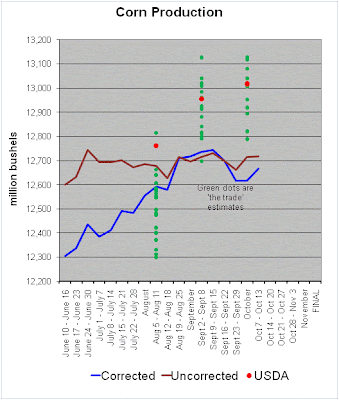
Pre-report trade estimates
However, at this point, the USDA still has historically made big adjustments between the October estimates and the final estimate (see the 2 posts before this one). The November estimates tend to be much closer to the final estimates.


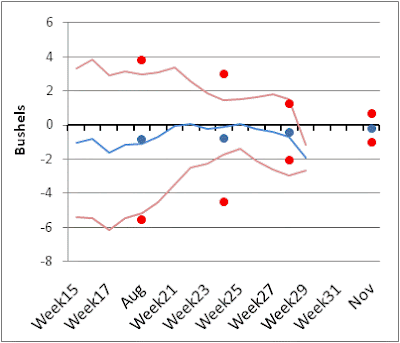
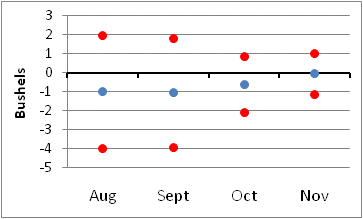
Comparing USDA and Model Performance
Wednesday, October 7, 2009
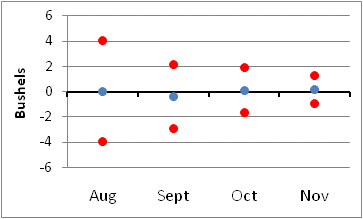
How does the USDA change its estimates through the year?
Not that I expect that I'll end up closer to USDA but I can hope. USDA could just as easily move further away from me on the upside for corn, or the downside for beans, but I'm given some hope by the recent corn and bean price movements that maybe on Friday I'll be a bit closer to USDA. I'll try to post those errors of my own work tomorrow and after the Friday report I'll give a state by state breakdown of how I compare. Email me if there is something else you want to see with respect to the errors. I've got some assistance in putting this all together so I can certainly promise somebody else's time to make it happen.


