Greetings everyone. After several inquiries about updating my blog I decided to do a quick update. As some of you may know, my research unit, FAPRI, has experienced some funding issues and I've been focusing my efforts on obtaining grants which provide a direct financial benefit and I've had to set this aside for a while. I decided I could do a quick update over my lunch hour this week.
Unlike previous years I did NOT re-estimate the equations yet. I simply dropped the data into the old equations. For the new folks I need to say I do NOT calibrate anything. if I'm close (such as the near spot on harvesting area for cotton) or I'm way off (cotton production) it is simply the result of the model. I don't change it through the year to improve fit, although I may re-estimate the equations with 2010 data if I have time. Please tell me if you see anything you find suspicious, I'm trying to shortcut some things in the sake of efficiency. Take a look at the spreadsheet linked below!
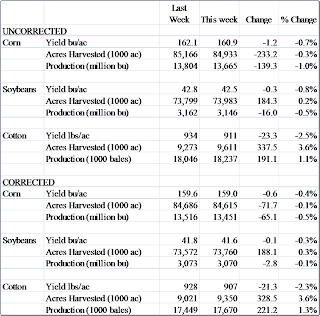
Corrected vs Uncorrected:
The uncorrected number indicates what the yield will be if conditions stay stable through the growing season. Normally conditions decline (droughts develop, damage accumulates, etc) so the corrected model corrects for a 'normal' decline. In fantastic years, conditions don't decline and the corrected model rises to the uncorrected model. In years of drought, the correction wouldn't be enough and they would both go lower. THE CORRECTED MODEL IS THE BEST GUESS, and you can use the uncorrected model to track week to week effects of condition changes.
If someone has the trade estimates, I'd like to put them as a scatter on the graph as in previous years but I have to rely on the kindness of someone to send them to me.
Corn
There isn't to much of a story here at an aggregate level. I'm quite close to current USDA trend estimates.
Soybeans
This is a different story, both corrected and uncorrected models are below the current USDA estimates. I'll look into the state estimates and report back where I have yield weakness. I don't yet have state by state estimates from USDA to compare them to, but I will include them with the August report.
Cotton
Here we see some significant differences worth talking about. I'm significantly higher than USDA for yield and production. I suspect a big part of this is coming out of Texas. Now it ISN'T abandonment, as my harvested area in the corrected model is within 11,000 acres of USDA harvest estimate of 9.6 million acres and the corrected model is actually 250,000 acres lower than current USDA harvested area. The difference is yields. Do my yield numbers look high? They certainly do, but there is somewhat of an inverse relationship between harvesting rates in Texas and yields. A portion of the area in very poor and poor condition isn't harvested and this drives up the harvested yield reported here. Yes I do agree that I'm still probably to high of course but consider this.
I'm running a harvesting rate LESS THAN 50% IN TEXAS. The last time Texas was even close to this was in 1998 at 57% harvesting rate in which Texas also had a record cotton yield for that time. I'd love to hear from somebody about how this has effected irrigated area in Texas and has the whole crop suffered or just the dry land cotton. I'd be curious as to the USDA yield number being used in Texas. If you take a 600 lbs/ac for Texas instead of my current number that would make up the whole difference. However, this would mean not only are the lower cotton acres in Texas being knocked out but all cotton acres are suffering. I simply have been preoccupied in finding funding and haven't been following the developments. I'm guessing I'm high across the board for the south too.
Spreadsheet with details Week16.xls
Wednesday, July 20, 2011
Subscribe to:
Post Comments (Atom)


No comments:
Post a Comment