Link to DTN article on crop progress and condition reports.
I said quite a bit more, of course, about the value of these reports. Just because data is subjective doesn't mean it doesn't have value or that you can't use it to estimate a number. I think people have used very simple techniques in the past, I'm doing something just a bit more precise and yes it isn't perfect but I'd put my record the last several years up against many of the industry folks.
I'll be re-estimating the model including last years data shortly and I should start with the yield and cropsize predictions starting the begining of June.
-Seth
Friday, April 2, 2010
Monday, February 1, 2010
Last estimates for the year.
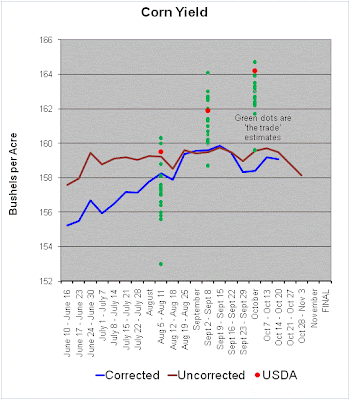
I finished quite far away for corn, closer for beans and cotton. When I look back at what pushed me away from the USDA's final estimates for corn I see Illinois and Indiana yields. As I indicated in several earlier posts, I use planting progress as a 'terminal' yield limiter. The crop in Illinois and Indiana in my trigger week was significantly behind. This would normally put a critical period of crop development during what is normally a hot and dry part of the year. However, along with this late crop planting progress came a wet and cool year in those states as well. The slow planting progress was far to limiting a factor on yields is my conclusion.


Tuesday, November 10, 2009
USDA markers


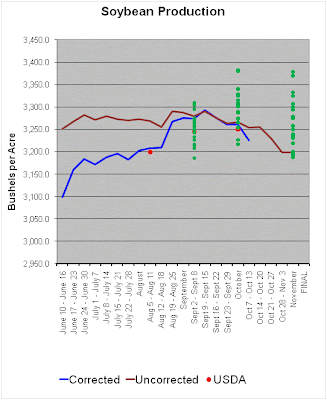
I added the USDA markers to my graphics. I'm in the unusual position of doing decently well in cotton and being farther off from USDA in corn and soybeans. This is not normally the case. USDA lowered corn yields, but I'm still quite far off, but they did break the trend of a big crop getting bigger. In soybeans they certainly moved it up and it was in the upper end of the range of trade estimates while I'm in the lower 1/2. For cotton, my abandonment percentage is different for Texas (and probably Arkansas) but the yield has been spot on this year, or at least it has followed the USDA estimates. I may get conditions next week, but I know some harvest decisions are being made and this is the latest we have had most of this info, so my numbers are unlikely to change. I'll continue to post if I have conditions, otherwise I'll look at the few votes on what crops to add and I'll get started on an additional crop or two for next season. I'll be looking forward to the January numbers as well.
Monday, November 9, 2009
Week32


We are over 50% harvest so I'm no longer getting conditions which is why my prediction is flat. I've updated this because I wanted to show the range in the trade at the moment, it is all over the board and has grown each week (the spread). Compare this to corn and you will see the spread has been a bit more consistent.

Tuesday, November 3, 2009
Tuesday, October 27, 2009
Any interest in wheat or other crops?
I'm considering constructing a similar model to run this spring for wheat, but I'd like to gauge interest before I spend any time doing it. Check out the poll on the right and leave your opinion. It is possible to do crops which are not listed by using conditions of a crop that are reported. I do that for some very minor states now (for example using soybean conditions to determine corn yields).
Week 30
For a discussion of why I no longer am publishing a corrected soybean condition, see the posts that follow this one. Also check the poll on the right. I'm about done with updates for the year. Once 50% of the crop is harvested conditions are no longer reported. This is the latest I've gotten soybean conditions since the data started in 1986 (in my week breakouts) and corn conditions should also be ending soon. You can clearly see in the estimates that harvest issues and concerns about test weights (?) are having an effect on conditions and therefore yield and production.
The yield numbers for cotton have fallen substantially since the first part of September. You will see in earlier posts where I think my errors are coming from on the production side (TX and AR). The yields, however, have tracked USDA reasonably well and so if you fit the model changes to USDA points we might see some sizable reductions in the USDA cotton production numbers in August. I should note that New Mexico has not reported conditions yet for the week so I'm using last weeks conditions carried over. Given the small size of New Mexico and the likelyhood of large changes in thier conditions from one week, this is probably not having a noticable effect on the outcome. You will be hardpressed to see the change when they finally release thier numbers.
I'll continue to post as long as I have conditions and then again near the time of the USDA November report, maybe the December report for cotton and then after the January report where numbers are usually 'final' or at least change little from that point for production and yield. Again I'll solicit any comments you have concerning this blog.

Subscribe to:
Posts (Atom)


