Wednesday, September 12, 2012

A quick post before the report so I have the estimates recorded.

I know I'm way off on corn. I've talked about it since mid-July. I'll be most interested to see if the USDA reduced the harvesting rate in the report due on half an hour. I'll put an analysis of absolute vs percent deviations on the work plan for the off season.

I've been quite accurate thus far on Soybeans and right now I'm sitting at the top of the trade estimates (which doesn't normally bother me as I've been closer than most of the trade thus far) but I'm guessing this report I could be a bit further off.

I'll be interested in what USDA does with cotton production and harvested area as well. I'm close on production, but because of the way the systems works I'm higher on yields and lower on harvested area.

Corn area harvested   85.370million acres
USDA estimated corn area harvested 87.400

Corn Yield:  140.1 bu/ac
Corn Production:  11,963 million bushels
latest USDA Production: 10,773 million bushels 

Soybean Yield:  37.7 bu/ac
Soybean Production: 2,801 million bushels
latest USDA Production = 2,692

Cotton Yield:  827 lbs/ac
Cotton Production 17.673 million bales 
latest USDA Production = 17.650 million bales


Thursday, September 6, 2012

Largely Unchanged

Sorry for the short post this week.

Corn area harvested   85.303million acres
USDA estimated corn area harvested 87.400

Corn Yield:  139.7 bu/ac

Corn Production:  11,918 million bushels
latest USDA Production: 10,773 million bushels 

Soybean Yield:  37.4 bu/ac
Soybean Production: 2,777 million bushels
latest USDA Production = 2,692

Cotton Yield:  835 lbs/ac
Cotton Production 17.851 million bales 
latest USDA Production = 17.650 million bales


Wednesday, August 29, 2012

Very stable this week, added trade estimates

Just an FYI, the folks sent a picture to Rome of an ear out of their field in western Iowa, the slow way by mail. 18 rows around and full length. If things haven't changed, they will have a decent crop at $8+ a bu.

I've added the trade numbers for comparison. My harvested area for corn is roughly consistent with the middle of the trade range. Yield and harvesting rates should be inversely related in their estimates. I haven't adjusted my model to use percent deviations as discussed and I doubt I'll have the time to do it in advanced of September 12th. Soybean numbers are in the middle of the trade range and cotton production is roughly consistent with USDA production numbers. Cotton yields are significantly too high but interact inversely with area (similar to corn this year) and while I look at these when estimating the equations I do not adjust them during the year and tend to pay more attention to the production numbers in total.


Corn area harvested   85.205 million acres
USDA estimated corn area harvested 87.400

Corn Yield:  139.5 bu/ac

Corn Production:  11,888 million bushels
latest USDA Production: 10,773 million bushels 

Soybean Yield:  37.2 bu/ac
Soybean Production: 2,760 million bushels
latest USDA Production = 2,692

Cotton Yield:  838 lbs/ac
Cotton Production 17.974 million bales 
latest USDA Production = 17.650 million bales


Wednesday, August 22, 2012

Slightly better conditions in corn and soybeans, lower for cotton

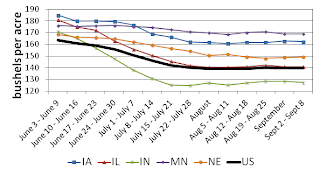
The corrected and uncorrected model are now converging (for a full explanation of the difference see previous years posts). I've added a graph on cotton area harvested as well to show the (over) sensitivity of the model to abandonment. Again, the chosen response of the model (read bushel deviations instead of percent deviations)  to abiotic stress (read drought) has cause the model to be significantly off this year for corn. If I have time in the off season this year, I'll do a percent deviations model, which has some issues that make it slightly more technically challenging, but I might also try to get the wheat model back up and running considering the interest in all grain markets at the moment. 

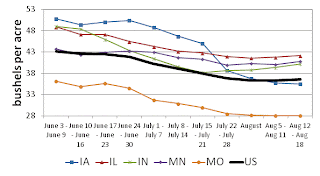
Soybean conditions improved so I've got just a bit more production. I was very close last week in predicting the USDA but I'm not up a bit and probably in the mid to bottom end of the pre-report trade estimates.

For cotton  I lost about another 140,000 bales this week. I was very close to the estimate by USDA and so I'm down just a bit further from there. As you can see, I''m probably too high on yields and perhaps too low on harvesting rates, which gets me back to the USDA estimate. I know yields are too high, but harvested area isn't as certain. This would say there is some additional downside potential for cotton area. I'll have to check in to see what the legends in Texas and Mississippi have to say. 

Corn Yield:  140.2 bu/ac
Corn Production:  11,990 million bushels
latest USDA Production: 10,773 million bushels 

Soybean Yield:  37.2 bu/ac
Soybean Production: 2,764 million bushels
latest USDA Production = 2,692

Cotton Yield:  832 lbs/ac
Cotton Production 17.452 million bales 
latest USDA Production = 17.650 million bales


Tuesday, August 14, 2012

Flat production estimates.

I was way off on corn, but as discussed last week, you could see this coming (absolute vs. percent deviations of the model structure), however, I was very close on both soybean (within 0.3% of reported production) and cotton (within 0.5% of production ). Things haven't changed much since that time. 

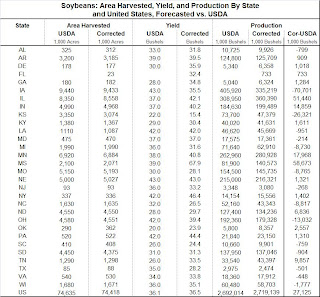
I've put up a state by state comparison with USDA so you can look more closely at how the states compare to USDA estimates. I've also put up a graph showing the harvesting rate coming out of the model compared to USDA. If I used their harvesting rate I would be even further off on production than I am now (the model is specifically designed to incorporate harvesting losses). I was a bit surprised at the number of acres they held into production but with $8 corn and $30 harvesting costs, it doesn't take many bushels to make harvest worth while. 

Corn Yield:  139.2 bu/ac
Corn Production:  11,957 million bushels
USDA Production: 10,773 million bushels 

Soybean Yield:  36.5 bu/ac
Soybean Production: 2,719 million bushels
USDA Production = 2,692

Cotton Yield:  821 lbs/ac
Cotton Production 17.593 million bales
USDA Production = 17.650 million bales

I've been asked why I don't fix the maize model if I know it is going to be wrong (re-specify it with % deviations). This is a very good point. My only reason is I don't like to change the model during the growing season most years as in other situations I've found I would have made inappropriate adjustments and the model was doing just fine (not the case this year for maize!). Secondly this is all for fun at the moment so to think about the best way to re-estimate the equations in short order might take away from my day job. 


Notice the numbers for Oklahoma cotton. The large difference is a lack of proper synchronization between the harvesting equation and the yield equation. So the harvesting falls off rapidly but this increases the yield at a pace which isn't realistic and thus you end up with production which is far too high.


Here, the US harvesting rate is holding at just over 90%. We saw much lower harvesting rates in 1988 and 1993 but the argument goes that the number and location of livestock was different and we won't see the same type of maize chopping we did during those years.