Tuesday, July 3, 2012

Declines accelerating and spreading with drought impacts for corn

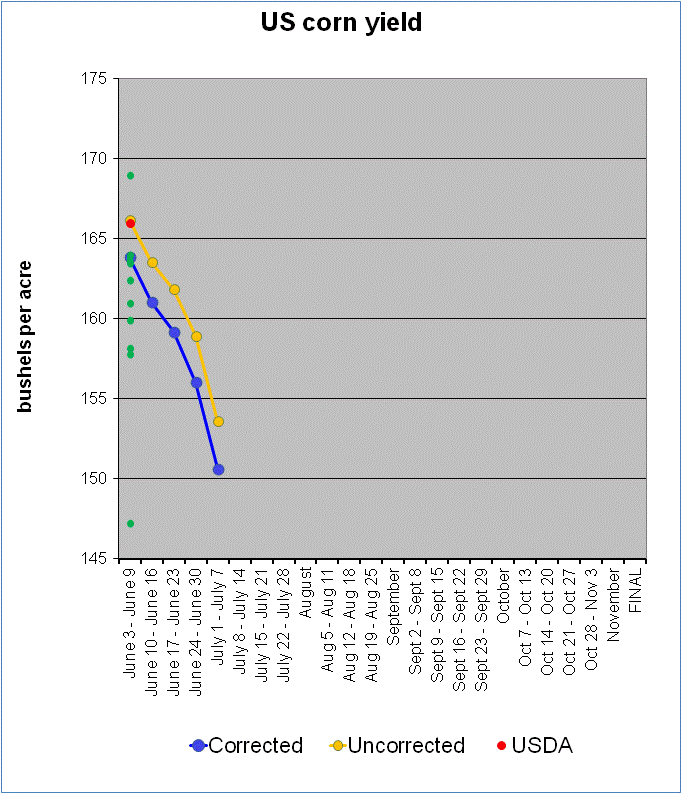
Corn Yield:  150.6 bu/ac
Corn Production:  13,255 million bushels

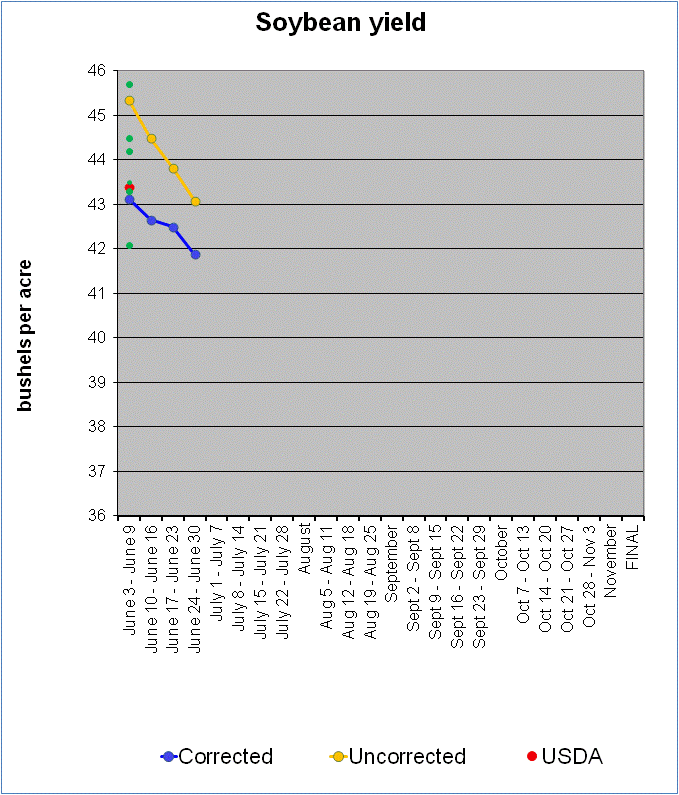
Soybean Yield:  40.2 bu/ac
Soybean Production: 3,010 million bushels

Greetings from Rome everyone:
It has apparently been more mild and cool here in Rome than has been experienced across the Mid-west this past week. I’ll set aside that apparently there was more snow accumulation in Rome than in Columbia MO this winter too!

The acreage report had little impact on corn production despite the increase in acres as the geographic shuffling of acres out of Iowa and into Illinois and Indiana where the drought was having the largest effect resulted in little production change. This week we see declines across the board, including Iowa, as the decline in yields and production gain speed. These are of course subjective measures and they tend to be influenced by short run events on occasion (cotton conditions and hurricanes is a good example*) so we will see how these numbers hold into next week. I will say that the effects appear to be spreading with a large decline in Iowa this week although still smaller than the declines in Illinois and Indiana again.

*I keep trying to find time to do additional commentary but as this is for my own entertainment, I’m limited in the amount of time I have. Remember, these are subjective data. A few years ago, when a hurricane came ashore, cotton conditions fell for two weeks then quickly rebounded. The short run extreme weather event colored folks perceptions of the crop. Now the drought is pretty severe so I’m not suggesting a jump back up next week, but it will be interesting to see if the declines continue so strongly in the next two reports.


Friday, June 29, 2012

More corn acres but not much additional production

Some noteworthy changes from the USDA Acreage report, particularly from some geographical switching.
1) Corn acres were adjusted up by 500,000 acres but I'm showing a more modest bump in production. Why? Acres increased in Illinois and Indiana where the drought seems to be hitting the hardest and shifted out of Iowa where things have thus far remained okay
2) Soybean acres jumped a bunchy and add to that the trade of  from 1) where bean acres in Iowa jumped while they fell in Illinois and Indiana and you get a nice production increase for soybeans from this acreage change.
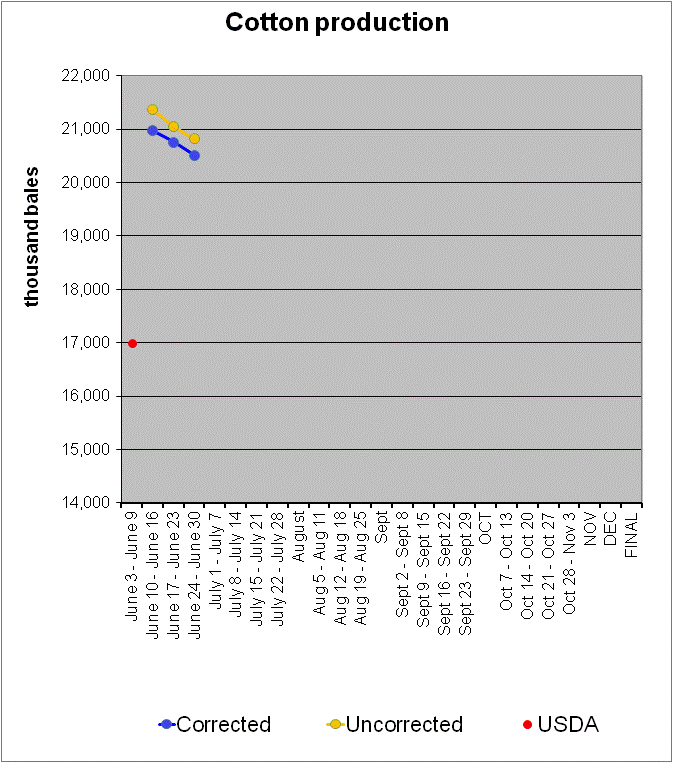
3) the change in cotton acres (a drop of 600,000 acres) trimmed 1 million bales off of my estimate I'm down at 19.6 million bales which is still a large production number given  my US harvesting rate (read Texas) is much higher than that proposed by USDA.


Thursday, June 28, 2012

13.8 Billion Bushels of Maize.....

I will add commentary as time allows, I was away from Rome on duty travel and have just returned today. I'm showing continued and large declines in both corn and soybeans with BIG declines in Illinois and India as this seems to be the focal point of the drought thus far. Iowa seems to be staying in reasonable shape thus far. The table below (not these are the corrected data) is available for all crops in a spreadsheet by request.


Tuesday, June 19, 2012

Week 3, more declines

Greetings from Rome. It is getting pretty warm here, but still cooler than it is in Champaign IL. More declines this week as the corrected maize yields fall below 160bu/ac pulling production down to 14 billion bushels. The corrected estimates for both maize and soybeans are now down at the bottom end of the trade range I have, but I'm guessing the next round of trade data will move further south as well. For next week, I'll try to do some state by state analysis on where the greatest yield impacts are occurring. A look at the spreadsheet (corrected numbers) shows an Iowa yield at 179.9bu/ac (from  184.6  bu/ac) but Illinois is at 172.2 (from    bu/ac 181.1)  so a bigger decline in that state at 8.9bu/ac in just the last couple of weeks. A similar pattern is holding in Soybeans where Iowa yields have declined by 0.8bu/ac while Illinois have fallen 1.7bu/ac over the same period. Indiana shows a similar (more extreme) decline as Illinois, all roughly consistent with the drought indices I saw last week.  

I will also try to work through the cotton model for next week. and identify the states where I've got the most issues (Texas) and come up with some alternatives as I don't believe what I have even though I expect a bigger cotton crop (at this point) than what he USDA has at 17 million bales. As always, the state by state yield and production estimates are available by emailing me. 


Tuesday, June 12, 2012

Greetings from Rome. 
I've got the webpage up and running but I'm working on a solution to put up the state by state spreadsheets. When I was on the faculty of the University of Missouri I would put it up on my webspace there, but as of this moment, I'm without a similar solution. The state by state breakouts are of course always available in a spreadsheet if you email me. 

A quick note on corrected vs uncorrected. The uncorrected model estimates the final yield based on the crop as it stands in the field today. If the reported condition of the crop never changed this would also be the final estimate, but we know conditions are likely to decline (perhaps through the accumulation of biotic and abiotic stressors). Therefore, the corrected model takes the average change from the current week to a week in mid September to adjust current conditions by the average decline. The adjustment is quite simple, but that is the whole point of this exercise. The corrected model is the best guess estimate.

So if conditions don't change the uncorrected model would be flat and the corrected model would rise to meet it. The two lines will converge in Mid-December. 

Below you will find the estimates for this week. Lets set aside cotton (for obvious reasons!) and we will come back to it in a moment. 

(Week 2 Estimates)


You can see from last week that my estimates went from the top of the trade (with one flier at 169) down to the center of the pack, and the best guess for production is now 14.2 billion bushels with an average yield of 161.3 bushels/acre. Both the corrected and uncorrected models are noticeably lower than the USDA estimate. 

Click on the graphs to zoom in


Soybeans tell a similar story of decline, but in this case the two estimates bracketed the trade estimates but the corrected model has now moved to the lower end of the trade range


Now for cotton, do I believe these results? No, not really, the calculated error for the first few weeks of reporting cotton yields are a regularly 150 lbs!  I've got several states where conditions are quite good plus I'm showing a low abandonment rate for Texas at the moment. This is in stark contrast to what WASDE is showing with what appears to be an assumption of around 40% abandonment rate in Texas. This, however, only accounts for part of the difference. The rest is state yields which are noticeably above
the previous 6 year average. This model has had some problems in the past, if you look at last year I was way off in the drought. The model didn't handle the 60% abandonment rate in Texas very well. However, the previous year I was (similar to this year) well above USDA numbers and did okay early in the season. In addition, I could simply have some unknown error. But in truth I wouldn't take much away from this for a few more weeks other than there is some upside potential in the crop.  I think the current WASDE estimate has cooked in a continued drought. I will say Carl Anderson was talking a 6 million bale Texas crop a few weeks ago, but that is a long time ago for this crop I suspect. There should be lots of movement in these numbers and I'll be looking more into the estimates as time allows (this isn't my day job).


Thursday, June 7, 2012

Postings to begin again for 2012 on June 12th

Crop estimates will begin again next week, here is a preview

Tuesday, August 23, 2011

Big declines in corn and soybean numbers

We saw significant declines in corn and soybean yields the last few weeks. For corn, my new number would be in the middle of the trade range but I have one observation from the trade this week that puts yields down at 150bu/ac, I'll have to adjust my graph axis! For soybeans I was well below the trade but very close to the USDA estimates. The only current trade estimate from this week is spot on with my results from this week. 

For cotton, well, the model simply blows Texas and it is clear that the situation there is not one we have seen in the last 27 years as there is nothing like it in the data. I don't like to mess with the model based on some arbitrary adjustment so I'm leaving it as is knowing I'm off track on that estimate. (clicking on the tables and graphs below will take you to an enlarged version).