Thursday, August 11, 2011

USDA comparison

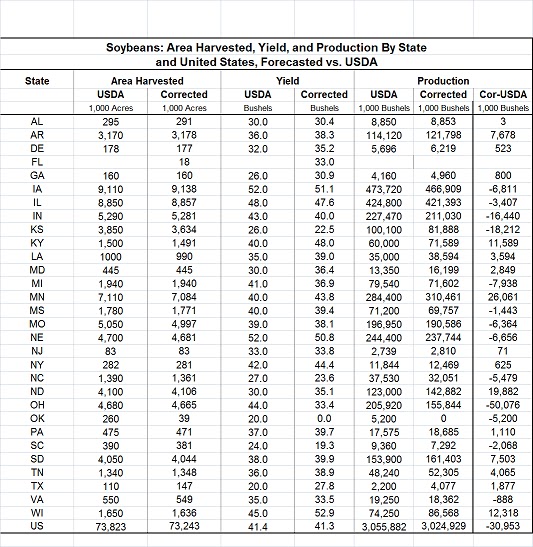
Graph comparisons are below the tables, here are the state by state comparisons with USDA estimates. I'm on the high side in corn, but so was most of the trade. The big (absolute) differences here seem to be in Iowa and Indiana where I'm significantly higher.

I'm spot on for soybeans well below the trade. For cotton, the difference appears to be Texas. I began this whole effort to try do a better job in cotton production. This will definitely be a year to include in the estimation period.

Note: Thinks are bad enough in Oklahoma for soybeans that it essentially wipes out production (yield wants to go negative!). This week, 87% of the crop was in poor or very poor condition so I've essentially dropped production out entirely. It isn't large enough to have a substantive effect on the total. 


Click on the table to get a larger view


Tuesday, August 9, 2011

Top of the trade range for corn, below the trade range for soybeans

I'm at the top of the current range of trade for corn, but I'm below all trade estimates for soybeans. Look at several states including Illinois in beans you can see why numbers are coming out where they are. I'll do a state by state comparison as usual when the August numbers come out. Spreadsheet Aug82011.xls


Monday, August 1, 2011


SPREADSHEET Aug12011.xls

I'm at the upper end of the corn trade estimates for yield. This is the third week of declines and the corrected model declined another 0.5 bu/ac this week. Corn production is at 13.3 bb which is also probably at the higher end of trade estimates.

For soybeans I'm considerably lower than current USDA estimates. I'm over 2 bu/ac lower on yields and about 200 million bushels lower on production. I don't have trade estimate numbers for comparison.

For cotton, I'm fairly confident I'm simply 'wrong'. The model isn't able to handle the conditions in Texas where the harvesting rate may be below 50%.


Tuesday, July 26, 2011

Corn and soybeans, perhaps not surprisingly, both moved lower this week. Remembering that the corrected model is the 'best guess' and the difference between corrected and uncorrected is the 'normal' decline. We lost over a bushel in corn this week on changes in conditions and a half a bushel in soybeans. When the August state by state numbers are released I'll post those comparisons as well.

In cotton, by all accounts I'm way to high. The model assumes that the condition numbers include all planted area. The crop in very poor and poor condition is never harvested and thus the remainder of the crop is in better average condition. So acres that move from fair to poor are not harvested and the average condition of the harvested crop moves higher. This appears to have been the case in Texas in 1998 when the harvesting rate was only 57% but there was a record crop yield. Having said that, I think we are operating well outside the models previous experience. I'm running a harvesting rate of less than 50% in Texas and my aggregate harvested area is at or slightly below that of USDA. There has been some suggestion that the land in Texas that was zeroed out isn't entering into the condition reports and that the conditions reported are for areas that will be harvested. This would suggest that what is rated 'fair' in dryland areas isn't the same condition as 'fair' in irrigated areas. This isn't the way it is supposed to be, but as a subjective measure I find it very plausible.


Wednesday, July 20, 2011

First estimate for the season (week 16)

Greetings everyone. After several inquiries about updating my blog I decided to do a quick update. As some of you may know, my research unit, FAPRI, has experienced some funding issues and I've been focusing my efforts on obtaining grants which provide a direct financial benefit and I've had to set this aside for a while. I decided I could do a quick update over my lunch hour this week.

Unlike previous years I did NOT re-estimate the equations yet. I simply dropped the data into the old equations. For the new folks I need to say I do NOT calibrate anything. if I'm close (such as the near spot on harvesting area for cotton) or I'm way off (cotton production) it is simply the result of the model. I don't change it through  the year to improve fit, although I may re-estimate the equations with 2010 data if I have time. Please tell me if you see anything you find suspicious, I'm trying to shortcut some things in the sake of efficiency. Take a look at the spreadsheet linked below!


Corrected vs Uncorrected:

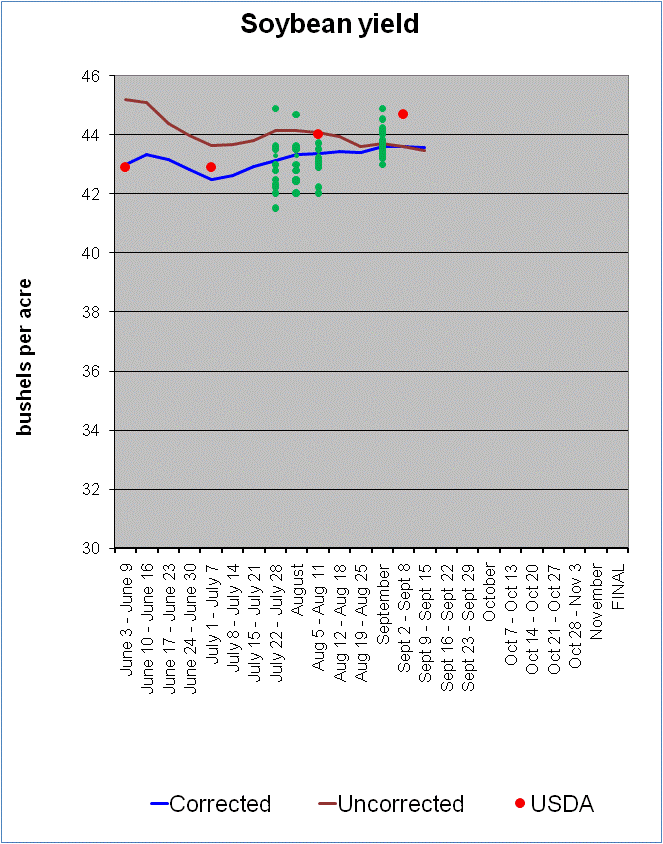
The uncorrected number indicates what the yield will be if conditions stay stable through the growing season. Normally conditions decline (droughts develop, damage accumulates, etc) so the corrected model corrects for a 'normal' decline. In fantastic years, conditions don't decline and the corrected model rises to the uncorrected model. In years of drought, the correction wouldn't be enough and they would both go lower.  THE CORRECTED MODEL IS THE BEST GUESS, and you can use the uncorrected model to track week to week effects of condition changes.

If someone has the trade estimates, I'd like to put them as a scatter on the graph as in previous years but I have to rely on the kindness of someone to send them to me.

Corn
There isn't to much of a story here at an aggregate level. I'm quite close to current USDA trend estimates.
Soybeans 
This is a different story, both corrected and uncorrected models are below the current USDA estimates. I'll look into the state estimates and report back where I have yield weakness. I don't yet have state by state estimates from USDA to compare them to, but I will include them with the August report.
Cotton
Here we see some significant differences worth talking about. I'm significantly higher than USDA for yield and production. I suspect a big part of this is coming out of Texas. Now it ISN'T abandonment, as my harvested area in the corrected model is within 11,000 acres of USDA harvest estimate of 9.6 million acres and the corrected model is actually 250,000 acres lower than current USDA harvested area. The difference is yields. Do my yield numbers look high? They certainly do, but there is somewhat of an inverse relationship between harvesting rates in Texas and yields. A portion of the area in very poor and poor condition isn't harvested and this drives up the harvested yield reported here. Yes I do agree that I'm still probably to high of course but consider this.

I'm running a harvesting rate LESS THAN 50% IN TEXAS. The last time Texas was even close to this was in 1998 at 57% harvesting rate in which Texas also had a record cotton yield for that time. I'd love to hear from somebody about how this has effected irrigated area in Texas and has the whole crop suffered or just the dry land cotton. I'd be curious as to the USDA yield number being used in Texas. If you take a 600 lbs/ac for Texas instead of my current number that would make up the whole difference. However, this would mean not only are the lower cotton acres in Texas being knocked out but all cotton acres are suffering. I simply have been preoccupied in finding funding and haven't been following the developments. I'm guessing I'm high across the board for the south too.


Spreadsheet with details  Week16.xls

Tuesday, September 28, 2010

Week 26

What happened to week 25? Well I got caught up on some of my work tasks and fell behind. I'll be updating next week before the October 8th crop production report. I'll try to get the estimates out Monday afternoon and then later in the week add the trade estimates 'pre-USDA report'. I can see where generally my blog traffic comes from and I think the phrase in the content industry is that I have a dedicated (euphemism for modest sized) following.

I've heard talk of lowered corn yields and the condition information shows a continued decline in yield and production. The condition information starts to be colored by the actual harvest data as we approach the October report so we can see some volatility in the condition numbers even in these last few weeks. Currrent information suggests a downward revision in corn yields.

For soybeans I'm stable while the USDA continues to increase yields. This type of movement is often consistent with me simply being 'off'. I'm not expecting a big change in the USDA numbers but we will see.

For cotton yield and production have been on a steady decline for several weeks. I've done a much better job in cotton than in previous years. As some of you may know this crop was a primary motivation for me to revive and seriously overhaul the model by John Kruse. I'm not yet ready to declare victory, but I'll say early results were quite excellent, particularly in relation to the rest of the trade. Look forward to a few more updates next week before the October Report.


Tuesday, September 14, 2010

Week 24 with USDA comparison


Let me start out by saying that I had a few conversations with people this week about my blog. I feel it important to note that while I am an agricultural economist, and I think the projections have been successful, I don't claim to be a professional. This was always an effort to show I could often beat the majority of trade estimates across all three crops early in the season while dedicating less than 1/2 hour a week to the task, including updating this blog. I hope you have all enjoy this but it is a hobby and isn't endorsed by anyone. Even I might distance myself from my soybean estimate this year.

I think I've tracked corn yields well this year. I'm higher than USDA on production and if I simply corrected the equation for harvesting rate in MN I'd be right on top of USDA for production as well. I tend not to make any adjustments to the equations at all but this one is a basic error and I may this week go back and adjust it.

For soybeans, I continue to lag USDA estimates. I think if you open the spreadsheet you can determine which states I'm the farthest from the USDA estimate.

For cotton I'm not on the low side of USDA but we will see where they end the year.

Harvest is underway so there are only a few weeks of conditions left. After October, USDA estimates normally change very little to the final estimate, so in October I can make a pretty good guess as to how accurate I may have been this year.