Tuesday, June 22, 2010

Week 12

I'm running at about 17.7 million bales of cotton production, 8 million of it coming from Texas. In discussion with some folks much more knowledgeable than I that 8 million doesn't seem to bad and might even be a bit low. I think the issue is that the model predicts an 'average' abandonment rate and this tends to be something around 10%. The problem is the 'average' never occurs, it is either 4% or 40% abandonment in Texas but seems to be rarely 'average'.

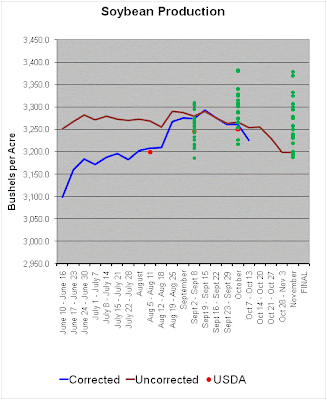
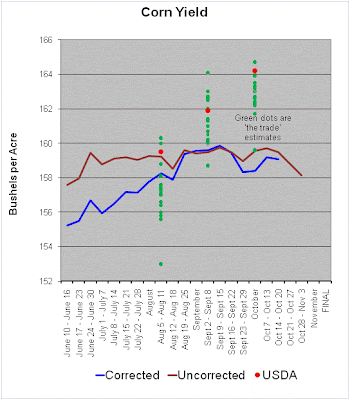
Just to refresh your memory the uncorrected model shows the yield if we FINISH the year with current conditions. The corrected model tries to adjust for the normal decline in conditions that occurs throughout the growing season and thus represents the best guess for the final yield. I did not adjust the correction values but will probably do so over the next couple of weeks to include the 2009 data which I have done everywhere else.


Wednesday, June 16, 2010


Friday, April 2, 2010

The blog made it to DTN

Link to DTN article on crop progress and condition reports.

I said quite a bit more, of course, about the value of these reports. Just because data is subjective doesn't mean it doesn't have value or that you can't use it to estimate a number. I think people have used very simple techniques in the past, I'm doing something just a bit more precise and yes it isn't perfect but I'd put my record the last several years up against many of the industry folks.

I'll be re-estimating the model including last years data shortly and I should start with the yield and cropsize predictions starting the begining of June.

-Seth

Monday, February 1, 2010

Last estimates for the year.

I finished quite far away for corn, closer for beans and cotton. When I look back at what pushed me away from the USDA's final estimates for corn I see Illinois and Indiana yields. As I indicated in several earlier posts, I use planting progress as a 'terminal' yield limiter. The crop in Illinois and Indiana in my trigger week was significantly behind. This would normally put a critical period of crop development during what is normally a hot and dry part of the year. However, along with this late crop planting progress came a wet and cool year in those states as well. The slow planting progress was far to limiting a factor on yields is my conclusion.

Tuesday, November 10, 2009

USDA markers


I added the USDA markers to my graphics. I'm in the unusual position of doing decently well in cotton and being farther off from USDA in corn and soybeans. This is not normally the case. USDA lowered corn yields, but I'm still quite far off, but they did break the trend of a big crop getting bigger. In soybeans they certainly moved it up and it was in the upper end of the range of trade estimates while I'm in the lower 1/2. For cotton, my abandonment percentage is different for Texas (and probably Arkansas) but the yield has been spot on this year, or at least it has followed the USDA estimates. I may get conditions next week, but I know some harvest decisions are being made and this is the latest we have had most of this info, so my numbers are unlikely to change. I'll continue to post if I have conditions, otherwise I'll look at the few votes on what crops to add and I'll get started on an additional crop or two for next season. I'll be looking forward to the January numbers as well.

Monday, November 9, 2009

Week32


We are over 50% harvest so I'm no longer getting conditions which is why my prediction is flat. I've updated this because I wanted to show the range in the trade at the moment, it is all over the board and has grown each week (the spread). Compare this to corn and you will see the spread has been a bit more consistent.

Tuesday, November 3, 2009