Greetings from Rome.
I've got the webpage up and running but I'm working on a solution to put up the state by state spreadsheets. When I was on the faculty of the University of Missouri I would put it up on my webspace there, but as of this moment, I'm without a similar solution. The state by state breakouts are of course always available in a spreadsheet if you email me.
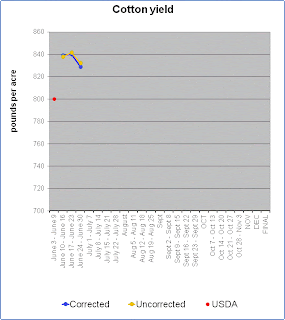
A quick note on corrected vs uncorrected. The uncorrected model estimates the final yield based on the crop as it stands in the field today. If the reported condition of the crop never changed this would also be the final estimate, but we know conditions are likely to decline (perhaps through the accumulation of biotic and abiotic stressors). Therefore, the corrected model takes the average change from the current week to a week in mid September to adjust current conditions by the average decline. The adjustment is quite simple, but that is the whole point of this exercise. The corrected model is the best guess estimate.
So if conditions don't change the uncorrected model would be flat and the corrected model would rise to meet it. The two lines will converge in Mid-December.
Below you will find the estimates for this week. Lets set aside cotton (for obvious reasons!) and we will come back to it in a moment.
(Week 2 Estimates)
You can see from last week that my estimates went from the top of the trade (with one flier at 169) down to the center of the pack, and the best guess for production is now 14.2 billion bushels with an average yield of 161.3 bushels/acre. Both the corrected and uncorrected models are noticeably lower than the USDA estimate.
Click on the graphs to zoom in
Soybeans tell a similar story of decline, but in this case the two estimates bracketed the trade estimates but the corrected model has now moved to the lower end of the trade range
Now for cotton, do I believe these results? No, not really, the calculated error for the first few weeks of reporting cotton yields are a regularly 150 lbs! I've got several states where conditions are quite good plus I'm showing a low abandonment rate for Texas at the moment. This is in stark contrast to what WASDE is showing with what appears to be an assumption of around 40% abandonment rate in Texas. This, however, only accounts for part of the difference. The rest is state yields which are noticeably above
the previous 6 year average. This model has had some problems in the past, if you look at last year I was way off in the drought. The model didn't handle the 60% abandonment rate in Texas very well. However, the previous year I was (similar to this year) well above USDA numbers and did okay early in the season. In addition, I could simply have some unknown error. But in truth I wouldn't take much away from this for a few more weeks other than there is some upside potential in the crop. I think the current WASDE estimate has cooked in a continued drought. I will say Carl Anderson was talking a 6 million bale Texas crop a few weeks ago, but that is a long time ago for this crop I suspect. There should be lots of movement in these numbers and I'll be looking more into the estimates as time allows (this isn't my day job).


