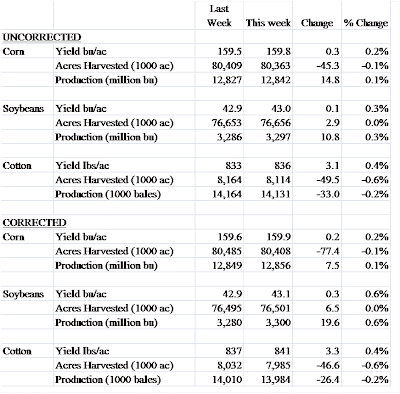
I receive information that the 18 state condition line is weighted by last years planted area numbers. While the simple average is close this week, that is coincidence (and honestly makes much more sense). So the national total weighted by last years planted area changed little, but when you break the states up, there are some declines in major states, and the only increases are in realtively minor or lower yielding states. I still cant determine why we get such a small national change while I see declines in yields for 18 states, increased yields in 6 states and no change in 17 states. The only think I can figure out is that the two biggest changes in percentage terms are 3% plus increases in GA and CO, with a 3% decline in AL. But I'm showing IA and IL and NE yields falling arround 1% from last week.
Last week (VP, P, F, G, Ex)
IL 2-7-29-49-13
IA 2-6-17-49-26
NE 2-5-14-52-27
This week (VP, P, F,G Ex)
IL 2-8-29-49-12
IA 3-6-16-52-23
NE 3-5-13-52-27
So in IL we had a one unit shift from EX to P, not a huge change but enough for a 1% decline in yields
In IA we had 3 units move from Ex to G and 1 from F to VP, enough for 1% decline in yields
in NE it was only one unit from F to VP that gave me 0.8% decine in yields
I use every condition catagory and I do not force some spread betwen the parameters on each condition, I only inforce that as you go up the scale of conditions, the paramter must be >1% than the previous category.
While I would like to think that state by state numbers would provide additional accuracy, I need to investigate how much of a difference it would make. Parsimony has always been one of the objectives of doing this. In this case it the condition movements are dependent on the differences between the condition parameters with a state and across states.
Tuesday, September 29, 2009
Week 26 crop condition yield and production
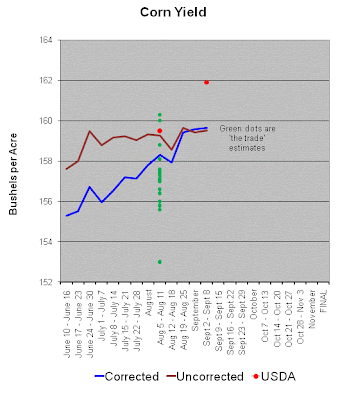
I show a pretty noticeable decline in yields this week in corn and . When you look at the 18 states corn condition line, and compare it to last week you won't perceive much of a change. You only see one unit move from excellent to good. I'm unsure of how the aggregation is made to the 18 state number, if it is weighted in any way by area, but it appears to be a simple average (I'm wrong, see the more recent post, it is weighted by last years planted area and just happens to be close to a simple average this week). If you look at the individual states you can see that Iowa and Illinois shown more noticeable declines which are made up in some smaller states and thus estimating the national number with just the national line will produce different results than adding up the states. The soybean estimate appears to follow the same pattern here.
I've also added last months trade estimates to my graphics. I do not have trade estimates for cotton yields, only production. Cotton yields would be nice to have as I believe my production difference here is largely due to a difference in abandonment rates in Texas. If I use the USDA number, I am quite close to the USDA production numbers. The equation which estimates Texas abandonment has historically been problematic and the source of much of my historic error.

I've also added last months trade estimates to my graphics. I do not have trade estimates for cotton yields, only production. Cotton yields would be nice to have as I believe my production difference here is largely due to a difference in abandonment rates in Texas. If I use the USDA number, I am quite close to the USDA production numbers. The equation which estimates Texas abandonment has historically been problematic and the source of much of my historic error.

Monday, September 21, 2009
Monday, September 14, 2009
Week24 Crop yield and Production Estimates
I've updated the USDA estimates from last week and added this weeks crop condition based yield and production estimates. With corn, USDA bumped up yield and production pretty substantially and I'm more than two bushels away on yield and a lower on production now. While there are state by state differences, there are a few comparisons that are worth mentioning. USDA is now higher than me in Iowa and Indiana. While my Illinois yield has risen substantially over the season, I'm still significantly below USDA. The opposite is true in Nebraska where I'm very substantially above USDA. Comments on the Nebraska crop are encouraged. For soybeans I continue to be above USDA in both yield and production. In cotton my yield is about spot on, but my production number is substantially higher. Again, while there are state to state differences, one can hang much of this on a difference in abandoned acres in Texas. I've received some comments on this issue but I'd sure like to hear what otheres think of my harvesting rate in Texas.


Tuesday, September 8, 2009
Outlining Biofuel RIN markets
In my day job at FAPRI, we created an extension to our baseline output to include an accounting and pricing of Renewable Identification Numbers (RINS) for biofuel markets. I thought there might be some interest in this given the importance to corn markets. The interactions can be complex given the nested nature of the mandate legislation.
Renewable Identification Number Markets: Draft Baseline Table FAPRI Report #07-09
Renewable Identification Number Markets: Draft Baseline Table FAPRI Report #07-09
Week 23 Crop Estimates
This is my last post from the Philippines, I'll be returning to the US and it appears to a pretty good corn crop. At the moment, I'm above USDA on everything but the corn yield where we are roughly similar. Of course I'm not trying to predict the intermediate USDA numbers but only the final, so we have a ways to go to see how well the model did. You can use the poll on the right to indicate how you think I'm doing in my crop predictions so far.


Subscribe to:
Comments (Atom)


